Analyzer
Analyzer is the chart workspace: one ticker, several timeframes side by side, on whichever exchange you choose. It is the only tool where you draw on charts.
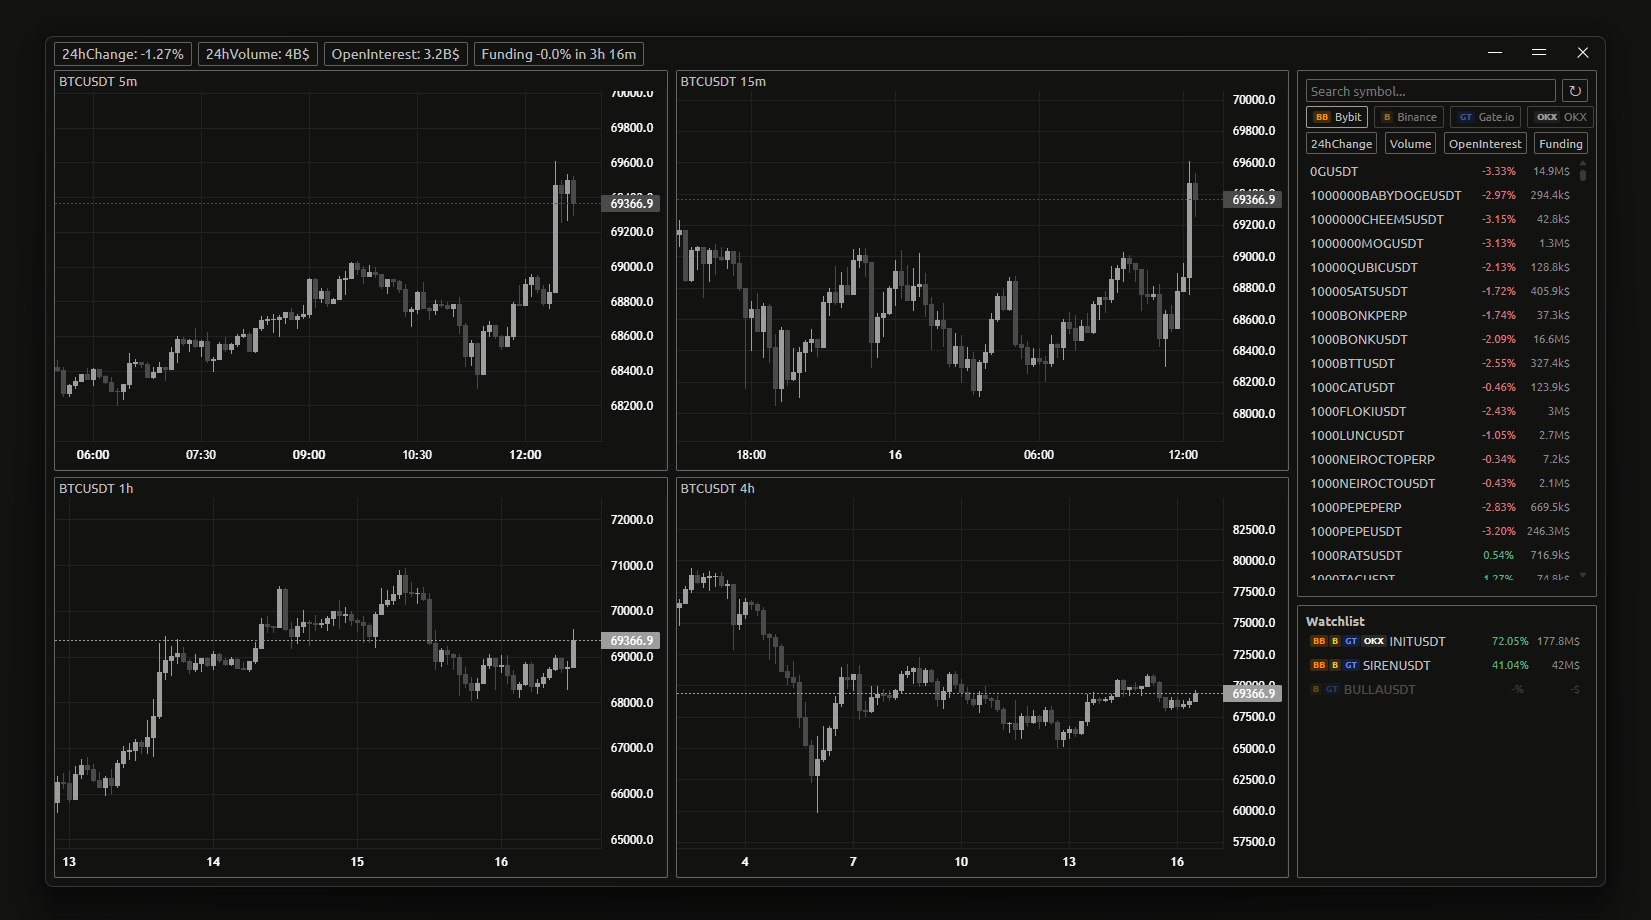
Unlike the other tools, Analyzer has almost nothing to configure in the main window — everything is controlled from the window itself, and your layout is remembered between sessions.
Layout
The window has two parts: a list panel on the left holding Markets and Watchlist, and the chart area on the right.
Choosing what to chart
Exchange
Five exchange buttons: Bybit, Binance, Gate (Gate.io), OKX and Hyper (Hyperliquid). Switching exchange reloads the ticker list and repoints every chart at the new exchange without a reload.
Drawings are stored per symbol and per exchange, so the same ticker on two exchanges keeps two separate sets of drawings.
Market type
FUT (perpetual futures) or SPOT. This changes which markets are listed and which metrics exist — see Metric columns.
Switching to SPOT resets the active metric to 24H%, since spot markets have no open interest or funding rate.
Search
The search box filters the ticker list, and it is deliberately forgiving:
- Punctuation, spaces, dashes and slashes are ignored.
- Queries of three characters or more tolerate a dropped or mistyped character.
- Cyrillic input is transliterated by keyboard position. Typing
ИЕСГІВЕwith a Ukrainian layout active matchesBTCUSDT, because those are the same physical keys. You don't have to switch layout to search.
Metric columns
The list shows a symbol column plus one or more metric columns:
| Column | Meaning | Markets |
|---|---|---|
| 24H% | Price change over 24h | Futures and spot |
| VOL | Trading volume over 24h, in USD | Futures and spot |
| OI | Open interest — total open positions, in USD | Futures only |
| FR | Funding rate | Futures only |
Click a column header to sort by it; click again to reverse the direction. An arrow marks the active sort.
How many columns are visible depends on how wide the panel is. Narrow the panel and it falls back to showing only the active metric; widen it and the columns reappear one at a time. Markets and Watchlist are measured separately, so they can be showing different numbers of columns at the same time.
Watchlist
Add a ticker from the Markets list with its + button; remove it from the Watchlist with ×. Each watchlist entry shows the logos of the exchanges that list it — hovering one reads Listed on <exchange>.
Listing badges reflect the current market type: a token that only trades on spot won't badge while you are in futures.
The watchlist persists between sessions.
Charts
Panels
Analyzer opens with four chart panels at 5m, 15m, 1h and 4h. That is a starting point, not a fixed layout:
- Add chart adds a panel, up to 8.
- Close chart removes one, down to a minimum of 1.
- Each panel has its own timeframe dropdown:
1m,5m,15m,30m,1h,4h,1d,1w.
Your panel layout and each panel's timeframe are saved, so the window comes back the way you left it.
History
Scroll left on any chart to load older candles automatically, in batches, as far back as the exchange provides.
Fullscreen
Each panel has an expand button that opens it fullscreen. In fullscreen the timeframe dropdown gains a star next to each entry — starred timeframes appear as a quick-access row, shared with the fullscreen views in Knives and Monitor.
Press Esc or the close button to exit.
Drawing tools
Five tools are available on every chart, each on its own key:
| Tool | Default key |
|---|---|
| Horizontal ray | H |
| Trend line | T |
| Rectangle | B |
| Pencil | P |
| Dissolving pencil | F |
Hold Ctrl while placing a point to snap it to the nearest candle high or low.
The active tool is tracked per chart panel, so you can be drawing a trend line on one panel while another is idle.
Keys, drawing color and magnet behaviour are all configurable — see Charts & drawing.
Settings
The Analyzer tab in the main window carries no settings. It holds the Open Window button and a notices section.
Known issues
The tab reports one known limitation, quoted from the app:
Gate.io charts take longer to load compared to other exchanges. This is a known limitation and a fix is being worked on.
Related
- Charts & drawing — candle colors, drawing color, tool shortcuts, magnet
- Monitor — ranked scanner; its cards also open fullscreen charts with the same drawing tools